

Pandas: The first tool you should master in Data Science (and probably the most underrated)
And why you should stop looping like a caveman


In the world of data science, we obsess over models.
Random Forests, Gradient Boosting, Transformers, LLMs…
But very few people talk about the tool that powers almost every data science workflow in Python.
A tool that is boring, but brilliant.
A tool that you won’t brag about, but you will use every single day.
That tool is Pandas.
Here is the truth no one told us in college. The first real superpower you need in Python isn’t machine learning. It is Pandas.


The misunderstood foundation
Most beginners think data science starts with machine learning.
It doesn’t.
It starts with opening a messy CSV file and figuring out:
What is even going on here?
Why are there 143 blank rows?
Why is the "Age" column sometimes a number and sometimes the word "unknown"?
Before you build, you need to explore.
Before you model, you need to clean.
Before you optimize, you need to understand.
And for that, there is Pandas.
So what is Pandas?
Pandas is a Python library for working with tabular data.
At a glance:
It helps you read Excel, CSV, or SQL files with one line of code
Lets you filter, sort, group, clean, and transform data
Turns chaos into clarity
It has two main data structures:
🔹 Series: A one-dimensional column with labels
🔹 DataFrame: A two-dimensional table — the real hero of the story
If NumPy is the engine of data science in Python, Pandas is the dashboard.
Pandas is built on top of NumPy but adds one thing that changes everything: labels - both for rows and columns.
Problem before Pandas


Why use Pandas?
Pandas gives you all the tools you need to:
Load data from CSVs, Excel, JSON, SQL
Filter rows, select columns, and slice datasets easily
Clean data — fill in missing values, remove duplicates
Aggregate and group data (e.g., average age by gender)
Merge multiple datasets and sort them
Prepare your data for ML models
In short: It replaces a lot of messy logic and makes your code clean, readable, and powerful.

Here is what I tell my students:
“If you are still looping through rows to calculate averages, you are working too hard.”
With Pandas, you can do in one line what used to take 20.
Want to calculate the average age of survivors in the Titanic dataset?
df[df['Survived'] == 1]['Age'].mean()Want to know the Titanic survival rate by gender?
df.groupby('Sex')['Survived'].mean()Want to fill all missing values in the “Age” column?
df['Age'].fillna(df['Age'].mean(), inplace=True)That's it. No loops. No drama. Just clean, elegant code.

The two main building blocks of Pandas
1. Series
A Series is a one-dimensional labeled array - like a single column of data. Think of it as a list with a label attached to every value.
import pandas as pd
s = pd.Series([90, 85, 88], index=['Math', 'Physics', 'Chemistry'])
2. DataFrame
A DataFrame is the heart of Pandas. It is a two-dimensional table with labeled rows and columns. It is how real-world data looks - like an Excel sheet or SQL table.
data = {
    'Name': ['Alice', 'Bob'],
    'Age': [25, 30]
}
df = pd.DataFrame(data)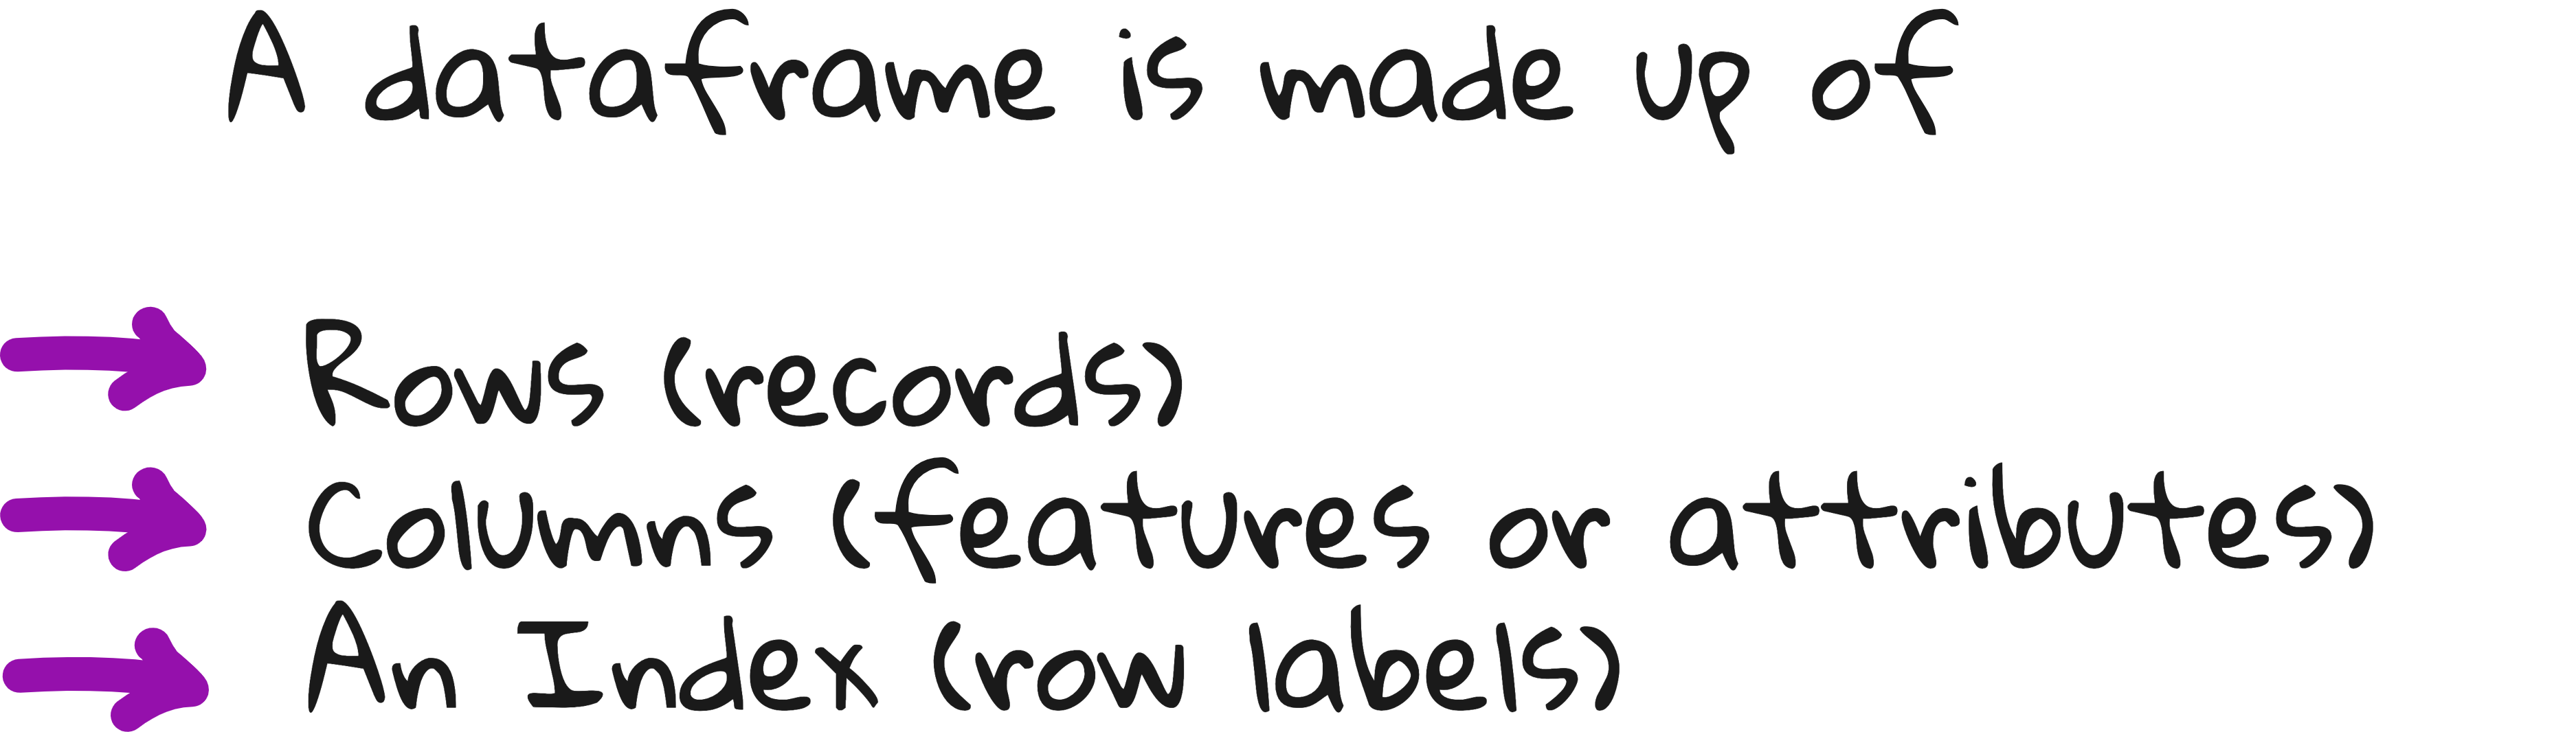
You will spend 90% of your Pandas time working with DataFrames - filtering rows, calculating group statistics, merging datasets, and cleaning missing values.


A project for demonstrating the power of Pandas
When I was recording my lecture on Pandas, I gave my students a simple challenge:
Use the Titanic dataset to figure out who was more likely to survive.

What they discovered was fascinating:
Women had a higher survival rate than men
Passengers in higher classes were more likely to survive
Children (age < 16) were treated preferentially - unless they were in 3rd class
They used .groupby(), .sort_values(), and .fillna() - and suddenly, data that looked like gibberish started telling a story.
That is the power of Pandas. It helps you move from rows to narrative. Let us perform some basic DataFrame operations to fully execute this project.
Dataframe basic operations
✅ 1. Load and understand the data
# Import necessary libraries
import pandas as pd

# Load the Titanic dataset
url = "https://raw.githubusercontent.com/datasciencedojo/datasets/master/titanic.csv"
df = pd.read_csv(url)

# Display the first 5 rows
df.head()
# Understand the structure of the dataset
df.info()
# Summary statistics for numeric columns
df.describe()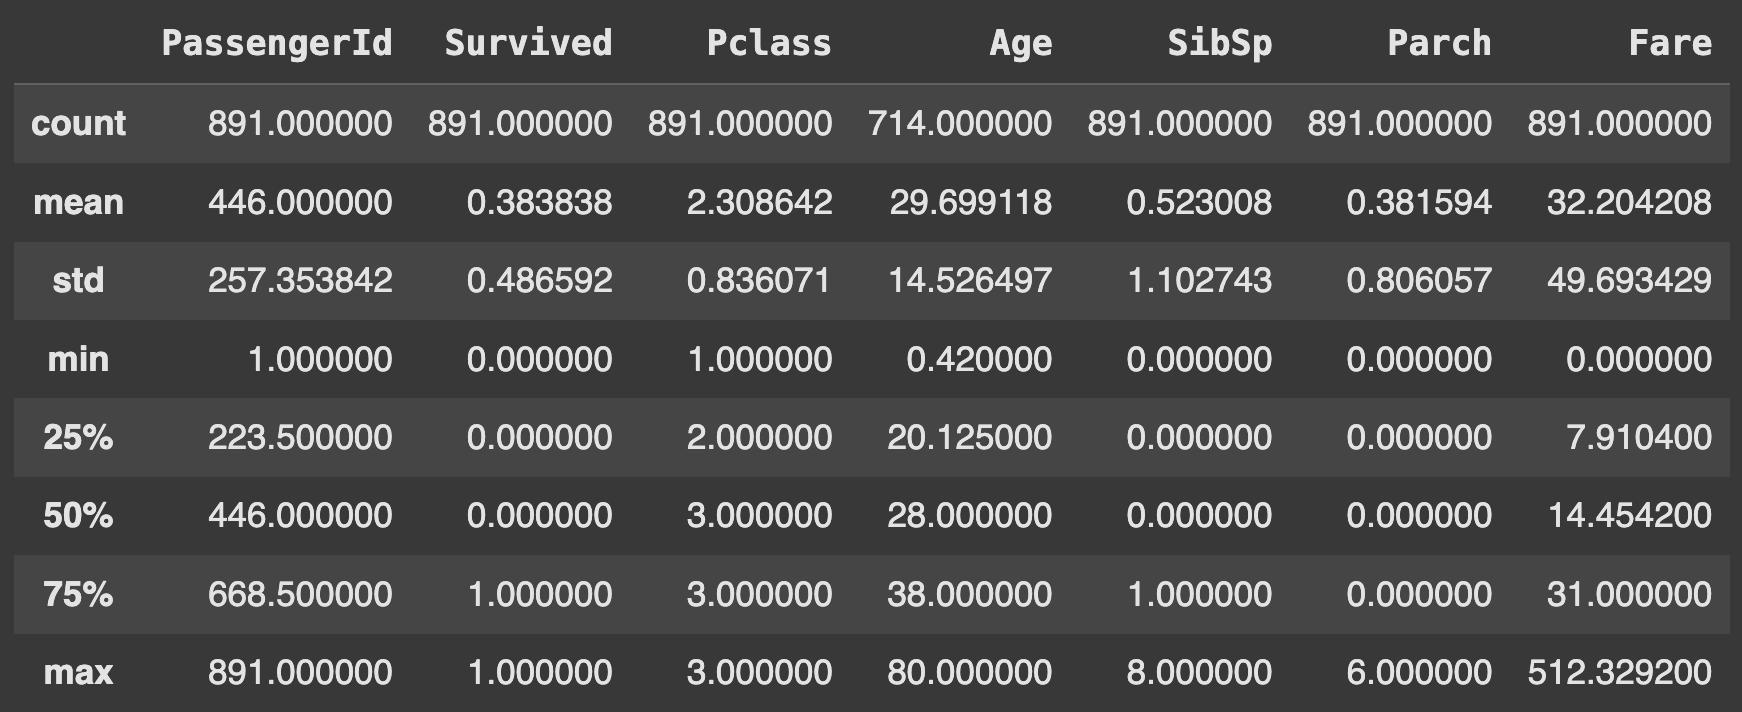
✅ 2. Handle missing values
# Check for missing values in each column
df.isnull().sum()
# Fill missing values in the 'Age' column with the mean age
df['Age'].fillna(df['Age'].mean(), inplace=True)
# Drop the 'Cabin' column due to too many missing values
df.drop(columns=['Cabin'], inplace=True)✅ 3. Analyze survival patterns
# Overall survival rate
df['Survived'].mean()
np.float64(0.3838383838383838)
# Survival rate by gender
df.groupby('Sex')['Survived'].mean()
# Survival rate by passenger class
df.groupby('Pclass')['Survived'].mean()
# Average age of survivors vs non-survivors
df.groupby('Survived')['Age'].mean()
# Survival rate of children (<16) vs adults (>=16)
df['IsChild'] = df['Age'] < 16
df.groupby('IsChild')['Survived'].mean()
✅ 4. Advanced insights (Bonus)
# Youngest passenger who survived
df[df['Survived'] == 1].sort_values(by='Age').head(1)
# Create a new column 'AgeGroup'
def classify_age(age):
    if age < 16:
        return 'Child'
    elif age <= 60:
        return 'Adult'
    else:
        return 'Senior'

df['AgeGroup'] = df['Age'].apply(classify_age)
# Analyze survival rate by AgeGroup
df.groupby('AgeGroup')['Survived'].mean()
✅ 5. Visualizations (Optional)
import matplotlib.pyplot as plt
import seaborn as sns

# Plot survival rate by gender
sns.barplot(x='Sex', y='Survived', data=df)
plt.title("Survival Rate by Gender")
plt.show()
# Plot age distribution of survivors vs non-survivors
sns.histplot(data=df, x='Age', hue='Survived', bins=30, kde=True, element='step')
plt.title("Age Distribution: Survivors vs Non-Survivors")
plt.xlabel("Age")
plt.ylabel("Count")
plt.show()
Where most people go wrong
The mistake most beginners make is this:
They jump into machine learning without mastering Pandas.
Result? They spend 80% of their time trying to clean and prepare data - inefficiently.
They write code that’s hard to debug, hard to share, and hard to scale.
If you are serious about working with data, Pandas isn’t optional.
It is the language your data speaks.
And learning to speak that language fluently will save you hours, every week.
Final thoughts
If you are just starting out:
Mastering Pandas will make everything else in your data science journey smoother - from NumPy to Scikit-learn to deep learning.
The syntax feels strange at first, but soon it becomes second nature.
You will stop reaching for Excel and start thinking about code.
Interested in learning ML from the foundations? Check this out
Lecture video
I have made a lecture video on this topic and hosted it on Vizuara’s YouTube channel. Do check this out. I hope you enjoy watching this lecture as much as I enjoyed making it.